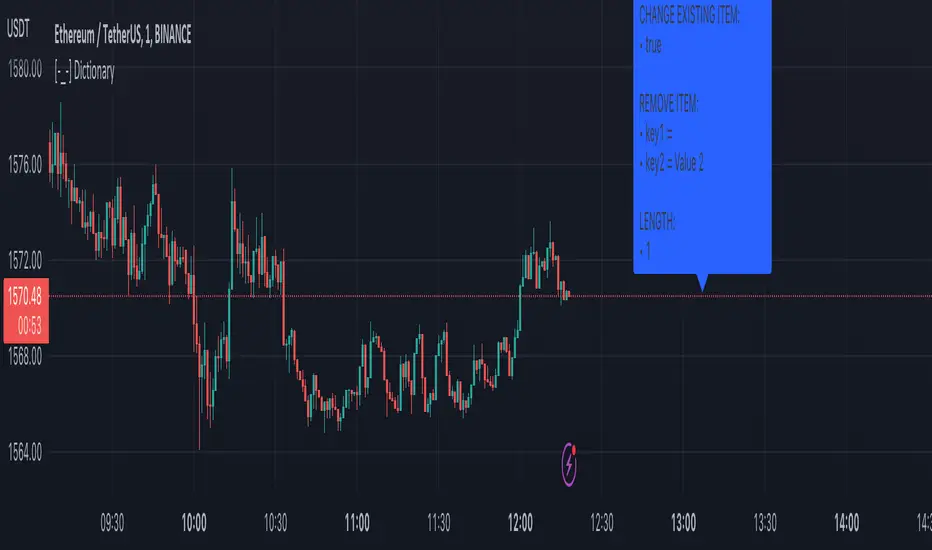
[-_-] DictionaryThe script shows an example implementation of dictionary-like data type which can store key:value pairs (Python style). Both keys and values can have any of the following type:
• string
• integer
• float
• boolean
• color
You can add items of different types to the same dictionary (e.g. key = 12 and value = "value" stored in the same dictionary with key = "key" and value = 0.23).
Under the hood dictionary is a custom Object (see www.tradingview.com), that has two array fields (one for storing keys, another for storing values). Keys and values of different types are converted into a string representation when adding a new item to the dictionary. The value is then converted back to certain type (bool/color/etc.) from that string representation when being retrieved. Script also utilises the new Methods (see www.tradingview.com).
The following methods are implemented:
• init() -> initialises the array fields of dictionary (without this the script throws an error "Array methods can't be called when ID of array is na"
• set(key, value) -> add a new item to dictionary; if an item for given key already exists - change it to new value
• getS(key) -> get value of string type
• getI(key) -> get value of integer type
• getF(key) -> get value of float type
• getB(key) -> get value of boolean type
• getC(key) -> get value of color type
• remove(key) -> removes item from dictionary
• len() -> get length of dictionary (the number of keys)
I could not make just one "get" function that returns any type of value (color/string/etc.), so instead I created a get function for each value type. Example usage:
• you add a string item: dictionary.set(2, "string here")
• you add a float item: dictionary.set(3, 24.56)
• to retrieve first value (key=2) do this: dictionary.getS(2)
• to retrieve second value (key=3) do this: dictionary.getF(3)
Cari dalam skrip untuk "the script"
Data structure map[string, float]The script shows a workaround for map in pine-script via drawings.
There are few restrictions with them:
1. The size of the map cannot be more that amount of allowed drawings (about 40 by now)
2. Because the map shares the space of drawings throughout the whole script, using drawings with the map must be careful, with handly creating and removing of each drawing, because otherwise pine's garbage collector might break the stack. I'd recommend not using more drawings with the map.
3. setters and getters must be called on every bar, because of implementation of functions in pine there are inner serieses, which must be updated on every bar. So wherever you have a setter or getter in the code - it must be called on every bar. But if it's just an update, then you should pass 'false' as a param of the funtion.
The script shows a way to work with the map: filling it with some tickers and values for each of it and then plot the value if the symbol on the chart equals to one of the tickers in the map.
And there are some examples of updating of the value and removing of the item from the map.

Workaround for Arrays in pine and Bubble sortThe script shows a workaround for arrays in pine-script via drawings.
There are few restrictions with them:
1. The length of the array cannot be more that amount of allowed drawings (about 40 by now)
2. Because the "array" shares the space of drawings throughout the whole script, using drawings with the "array" must be careful, with handly creating and removing of each drawing, because otherwise pine's garbage collector might break the "array"
3. Getter and Setter must be called on every bar, because of implementation of functions in pine there are inner serieses, which must be updated on every bar. So wherever you have a setter or getter in the code - it must be called on every bar. But if it's just an update, then you should pass 'false' as a param of the funtion.
The script also shows an example of implementation of bubble sort of the array in pine: when the array have been created, it's filled with pseudo-random numbers and sorted on every bar. There are plotting of the array's numbers before/after soring to show the sorting result.

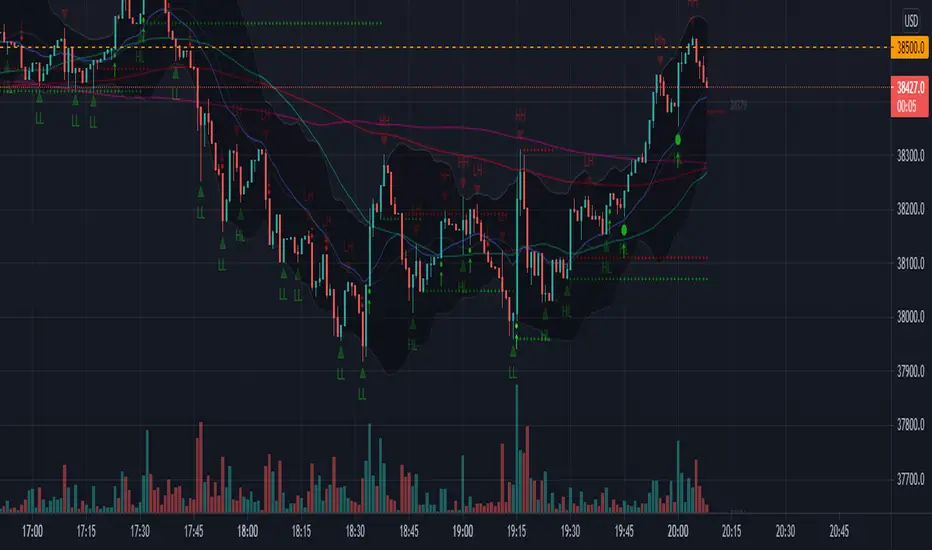
BySq - Market PsychologyThe script I provided is a Market Psychology Index indicator for TradingView, which focuses on three key psychological market phases:
FOMO (Fear of Missing Out)
Panic Selling
Reversal
This indicator uses volume, price changes, and specific time periods to gauge market sentiment. Let me break it down:
1. Input Parameters:
FOMO Period: Defines how many bars (candles) the FOMO index will consider for its calculation.
Panic Period: Defines the period to evaluate Panic Selling.
Reversal Period: Defines the period to evaluate potential price reversals.
You can adjust these periods based on your analysis preferences. The default for each period is 14.
2. FOMO Index:
The FOMO Index aims to capture the "fear of missing out" behavior in the market.
It uses volume and price change:
Volume is compared to the Simple Moving Average (SMA) of volume over the specified period.
Price change is calculated as the percentage change in price compared to the previous bar.
If both volume and price change indicate strong upward movement, the FOMO index spikes.
3. Panic Selling Index:
The Panic Selling Index captures when traders are selling out of fear, often in a rapid or irrational way.
Similar to the FOMO Index, it considers volume and price change:
It uses volume and compares it to the SMA of volume for the panic period.
Price change is negative, meaning it considers only price drops.
When there is high volume coupled with significant price drops, it signals panic selling.
4. Reversal Index:
The Reversal Index aims to detect potential trend reversals in the market.
This index also considers volume and price change:
It focuses on upward price movement and compares volume to its SMA.
If there’s strong upward price movement along with increasing volume, it signals the possibility of a price reversal.
5. Graphical Output:
Histograms are drawn on the chart for each of the three indices:
FOMO is shown in green (indicating the presence of FOMO) and red (when the index is low).
Panic Selling is shown in orange.
Reversal is shown in purple.
The Zero Line (horizontal dotted line) helps identify when any of the indices is positive or negative.
6. Labels:
Labels for each index are shown on the chart at the relevant bar when the index spikes.
FOMO is labeled "FOMO" in green when it spikes.
Panic Selling is labeled "Panic Selling" in orange when it spikes.
Reversal is labeled "Reversal" in purple when it spikes.
Additionally, period labels show above the chart, indicating the specific periods (FOMO, Panic, and Reversal periods) currently being applied. This provides clarity on what time frame each index is analyzing.
7. How to Use:
FOMO: High values may indicate that traders are buying out of fear of missing out on a rally, suggesting a potentially overheated market.
Panic Selling: High values could suggest irrational selling behavior or capitulation, potentially marking the bottom of a downtrend.
Reversal: High values signal the potential for a market reversal, where the price could change direction due to increased volume and upward movement.
8. Visual Appearance:
The indicator’s histograms change colors based on the level of market sentiment detected. The color-coded approach provides an easy-to-read visual representation of different psychological phases in the market.
The horizontal zero line allows easy differentiation between positive and negative values.
Summary:
This script combines the psychology of the market (FOMO, Panic Selling, and Reversal) into a set of indicators that help traders identify potential turning points or emotional states in the market. By focusing on volume and price change, the script attempts to give a clear picture of market sentiment and possible future movements.

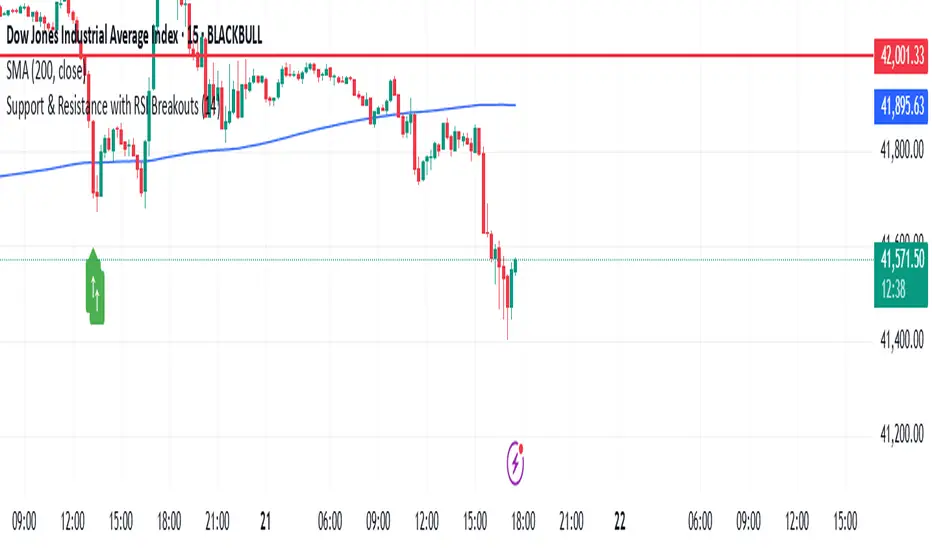
Support & Resistance with RSI BreakoutsThe script is a TradingView Pine Script (v5) indicator that identifies support and resistance levels using RSI (Relative Strength Index) breakouts. Here’s a breakdown of what it does:
Features:
RSI Calculation:
The script calculates the 14-period RSI (default) using the closing price.
The user can modify the RSI period through an input setting.
Buy and Sell Signals:
A buy signal is triggered when RSI drops below 20 (indicating oversold conditions).
A sell signal is triggered when RSI rises above 80 (indicating overbought conditions).
Visual Representation:
Buy signals are marked with a green upward arrow (↑) below the price bars.
Sell signals are marked with a red downward arrow (↓) above the price bars.
The arrows help traders easily spot potential trade opportunities.
Usage:
This script is useful for traders looking to buy at oversold conditions and sell at overbought conditions based on RSI.
It works best when combined with other indicators or price action strategies to confirm signals.
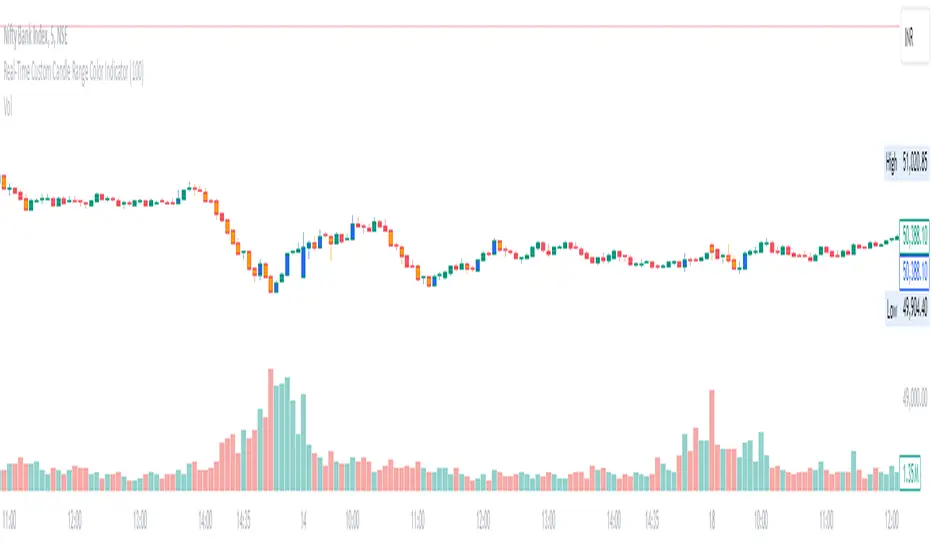
Real-Time Custom Candle Range Color Indicator
The script allows the user to input a custom range value (default set to 100 points) through the userDefinedRange variable. This value determines the minimum range required for a candle to change color.
Calculating Candle Range:
The script calculates the range of each candle by subtracting the low from the high price.
Determining Bullish or Bearish Candles:
It checks whether the close price is higher than the open price to determine if a candle is bullish (isBullish variable).
Coloring Candles:
Based on the custom range input, the script changes the color of the candles:
If the candle's range is greater than or equal to the custom range and it is bullish, the candle color is set to blue (bullishColor).
If the range condition is met and the candle is bearish, the color is set to orange (bearishColor).
If the range condition is not met, the color is set to na (not applicable).
Plotting Colored Candles:
The plotcandle function is used to plot candles with colors based on the custom range and bullish/bearish conditions. The candles will have a higher z-order to be displayed in front of default candles.
Displaying High and Low Price Points:
Triangular shapes are plotted at the high and low price levels using the plotshape function, with colors representing bullish (blue) and bearish (orange) conditions.
In trading, this indicator can help traders visually identify candles that meet a specific range criteria, potentially signaling strength or weakness in price movements. By customizing the range parameter, traders can adapt the indicator to different market conditions and trading strategies. It can be used in conjunction with other technical analysis tools to make informed trading decisions based on candlestick patterns and price movements.
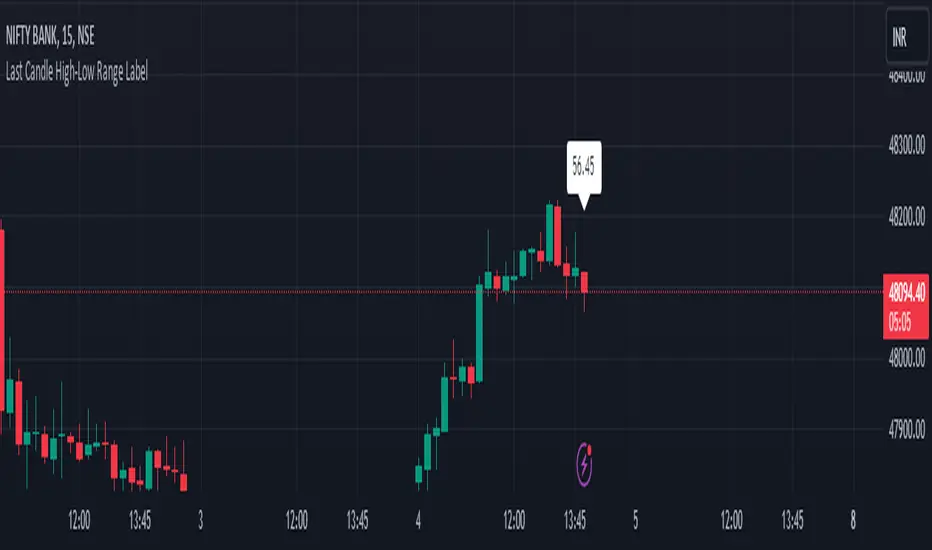
HL range by durgaThe script we've been working on is an indicator designed to display the high-low range of the last candlestick on a TradingView chart. It does so by plotting two lines: one for the high and another for the low of the last completed candlestick.
Additionally, the script includes a label that shows the numerical value of the high-low range. This label is positioned between the plotted lines, showing the difference between the high and low prices of the last candlestick.
The script operates in real-time, updating dynamically as new candlesticks form. Furthermore, it automatically removes the label after the close of the candlestick, maintaining a clean and clutter-free chart.
This indicator can help traders quickly visualize and assess the range of the last completed candlestick, aiding in their analysis of price action.
ETH Volume*Close Top Exchanges in millions $The script is designed to create a custom indicator that calculates the total volume of Ethereum traded on various exchanges, calculated in millions of dollars, and then plots a histogram of that volume along with a Simple Moving Average (SMA) of the volume.
The script starts by setting some input parameters such as the length of the SMA and the range period. It then requests data on the volume of Ethereum traded on several exchanges such as Binance, Coinbase, Kraken, and others. It calculates the combined total volume across all these exchanges and multiplies it by the close price of Ethereum to get a value in millions of dollars.
The script then checks if the volume is rising while the price is lower than the previous 5 bars high and higher than the previous 5 bars low, and if so, it sets the color of the histogram bars to white. It then plots the histogram bars and the SMA on the chart.

BTC Volume*Close from Top ExchangesThe script is designed to create a custom indicator that calculates the total volume of Bitcoin traded on various exchanges, calculated in millions of dollars, and then plots a histogram of that volume along with a Simple Moving Average (SMA) of the volume.
The script starts by setting some input parameters such as the length of the SMA and the range period. It then requests data on the volume of Bitcoin traded on several exchanges such as Binance, Coinbase, Kraken, and others. It calculates the combined total volume across all these exchanges and multiplies it by the close price of Bitcoin to get a value in millions of dollars.
The script then checks if the volume is rising while the price is lower than the previous 5 bars high and higher than the previous 5 bars low, and if so, it sets the color of the histogram bars to white. It then plots the histogram bars and the SMA on the chart.

Adaptive Weighted Moving Average (AWMA)The script is a technical analysis indicator that calculates a weighted moving average of a given data series. The weighted moving average is calculated using a custom weighting scheme that adjusts the weights based on the volatility of the market, as measured by the average true range (ATR) indicator. The resulting weighted moving average is smoothed using a Gaussian moving average, and the resulting smoothed moving average is plotted on the chart.
To use this script, the user can customize several input parameters, including the length of the moving average, the primary and secondary weights to use in the custom weighting scheme, the ATR length, and the smoothing parameter for the Gaussian moving average. With these inputs, the script calculates and plots the weighted moving average on the chart, allowing the user to analyze the trend and behavior of the data series using a custom weighted moving average.

Cash Gaps on a Future/CFD-ChartThe script is based on the great work of @NgUTech which very nicely prints the gaps on any given chart.
The purpose of this script is to show the gaps to futures or cfd of the underlying cash chart, because very often gap closing provides an opportunity to fade the move.
The script works in the way that the user provides the underlying chart symbol and the current spread of the instruments (cash-future/cfd) and it draws boxes where the cash-gaps are.
If you know a way to automatically calculate the spread of the two instruments, please let me know, thanks.
Michael

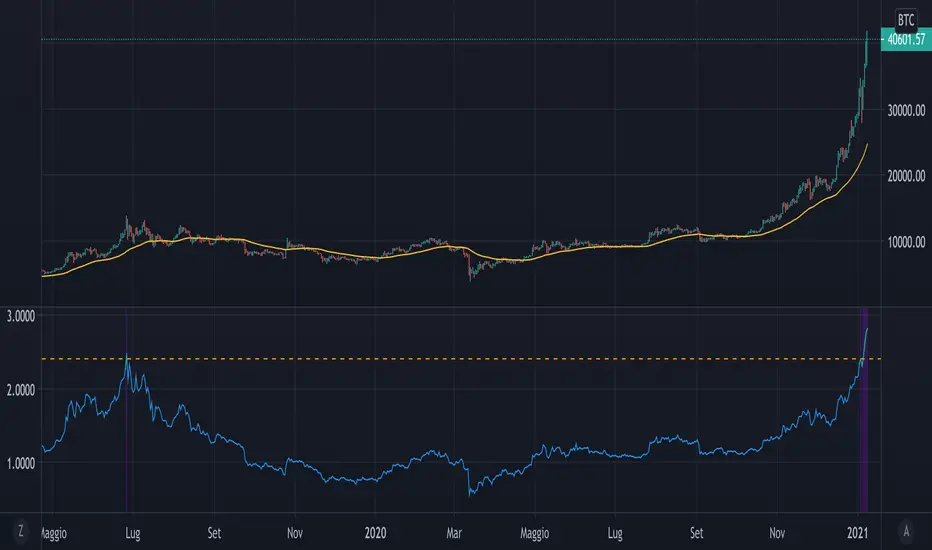
Mayer MultipleThe script implements a custom version of the Mayer multiple and it may be useful for analyzing the price of Bitcoin in a historical context.
Note n.1: Mayer multiple does not tell whether to buy, sell or hold, but highlights the best long-term area when the bitcoin price is below a threshold value (2.4).
Note n.2: the threshold value (2.4) has been determined in the past by simulations performed.
The script user may decide whether to use the shown graph or another graph for the calculation of the Mayer multiple.
The script is very easy to use and it is possible to change the following parameters:
the period of SMA (default value is 200)
the threshold (default value 2.4)
Show or not the sell area
Use or not the shown graph to calculate the Mayer multiple (default value is true)
name of exchange to use for calculation of the Mayer multiple (default value is BNC)
name of chart to use for calculation of the Mayer multiple (default value is BLX)
OFA - Order Flow AnalysisThe script analyzes order flow based on fractal structure breaks. Every time there is a fractal breakout in the opposite direction of the dominant side in control a new leg ( bullish or bearish ) forms. This script comes with the added value of displaying the velocity and the magnitude of each leg/cycle.
Order flow leaves a trail of the future market intentions via the ability or lack thereof of the aggregated flow to keep consuming liquidity provided by market makers and find or not equilibrium in price. The proper reading of order flow can provide information advantage. Flows can be read via two main venues:
1 - Magnitude: A major clue that will help determine the health of a trend is the type of progress by the dominant side in control of the trend. We need to ask the following question: Are the new legs in the active buy-sell side campaign as identified by the script increasing or decreasing in magnitude?
2. Velocity: When it comes to the distance the price moves, the magnitude is only ½ the equation. The other ½ has to do with the velocity of the move or the speed. Was the new leg created after a fast and impulsive move? Or did price make a new low or high with the movement being sluggish, compressive and taking too long to form? A good rule of thumb is to count the number of candles it took to achieve a new leg.

historical volatility by flashThe script is made to help to determine OPTIONS volatility.
The Script is showing the Historical volatility of any stock for its last 1 year data.
Historical volatility is important to know how stock can perform in panic days.
Historical volatility is best used with Implied volatility.
How to Interpret the Script or How to use it?
The Script show 5 parts the lowermost is lowest HV in last year & the highest part shows highest volatility in the past 1 year.
Use this on a DAILY CHART only.
Now Take the IV (implied volatility of stock) and put that figure in between the HV and check in which part current IV resides. based on that you can determine how OPTIONS premium or how much it INFLATED or DEFLATED .

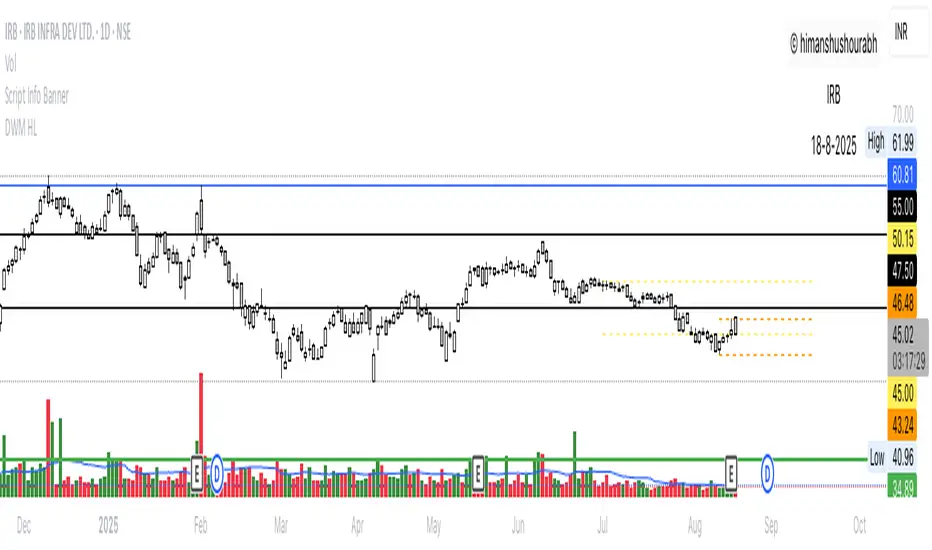
Script Info BannerThe script includes a small template displaying the username, script name, and date of analysis. This feature is implemented to establish credibility and prevent unauthorized use of the analysis.
Stock Earnings Viewer for Pine ScreenerThe script, titled "Stock Earnings Viewer with Surprise", fetches actual and estimated earnings, calculates absolute and percent surprise values, and presents them for analysis. It is intended to use in Pine Screener, as on chart it is redundant.
How to Apply to Pine Screener
Favorite this script
Open pine screener www.tradingview.com
Select "Stock Earnings Viewer with Surprise" in "Choose indicator"
Click "Scan"
Data
Actual Earnings: The reported earnings per share (EPS) for the stock, sourced via request.earnings().
Estimated Earnings: Analyst-predicted EPS, accessed with field=earnings.estimate.
Absolute Surprise: The difference between actual and estimated earnings (e.g., actual 1.2 - estimated 1.0 = 0.2).
Percent Surprise (%): The absolute surprise as a percentage of estimated earnings (e.g., (0.2 / 1.0) * 100 = 20%). Note: This may return NaN or infinity if estimated earnings are zero, due to division by zero.
Practical Use
This screener script allows users to filter stocks based on earnings metrics. For example, you could screen for stocks where Percent Surprise > 15 to find companies exceeding analyst expectations significantly, or use Absolute Surprise < -0.5 to identify underperformers.

Aggregation BTC CVDThe script calculates the Cumulative Volume Delta (CVD) for multiple cryptocurrency exchanges, then averages these values and plots them.
Indicator Setup:
The script sets up an indicator called "BTC Cumulative Volume Delta (CVD) for multiple cryptocurrency exchanges", displayed as a separate panel (not overlaid on the price chart) with volume format.
Getting 1-minute data from multiple exchanges:
It retrieves 1-minute data (buy and sell volumes) for Bitcoin (BTC) against USD or USDT from several exchanges: Binance, OKEx, Coinbase (both BTCUSDT and BTCUSD), Bitfinex, Bybit, Huobi, and Kraken.
Calculating total buying and selling volume for each exchange:
For each exchange, it calculates the total buying volume (buy_vol_...), selling volume (sell_vol_...), and the difference between them (delta_vol_...).
It then computes the cumulative delta volume (cum_delta_vol_...), which is a running total of delta_vol_....
Calculating the average CVD:
It calculates the average cumulative delta volume (average_cum_delta_vol) by summing the cumulative delta volumes from all exchanges and dividing by the number of exchanges.
Plotting the average CVD:
Finally, it plots the average CVD with white color, and a line width of 2.
This script essentially provides an averaged Cumulative Volume Delta across multiple exchanges, giving a comprehensive view of buying and selling pressure in the Bitcoin market across these platforms.

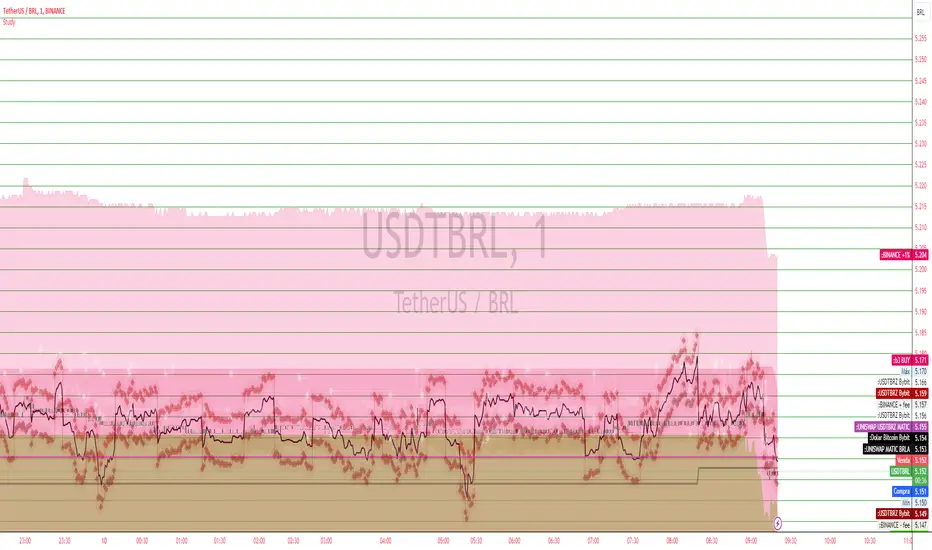
USD BRL Exchange Rate Discrepancy Analysis ScriptThe script is designed to visualize and analyze discrepancies in the exchange rates of USDT to BRL (Tether to Brazilian Real) and USDT to BRZ (Tether to Brazilian Digital Token) across various trading platforms. It fetches the closing prices of multiple trading pairs from different platforms like Bybit, Binance, and Uniswap. The primary focus is to calculate and plot the conversion rate of BTCBRZ (Bitcoin to Brazilian Real) to USD. Additionally, the script highlights the differences in buy and sell rates for USDT-BRL and USDT-BRZ pairs, including fees and percentage adjustments. Visual elements like lines and areas are used to represent these rates, offering a comprehensive view of potential arbitrage opportunities in the Bitcoin market across different exchanges.
terrible financial advisorThe script you're looking at is a humorous "financial advisor" that places funny and non-traditional investment advice labels on a trading chart. The advice doesn't really have any meaningful connection to real financial indicators or market trends, and it's meant for entertainment purposes only.
Here's how it works:
Every 23 bars on the chart (a bar could represent a day, an hour, or another period, depending on the chart settings), the script places a new label.
The content of each label is determined by the remainder when the current bar number is divided by 10.
Keep in mind that this script is just for fun, and you shouldn't base any real investment decisions on its output!
it works as intended.

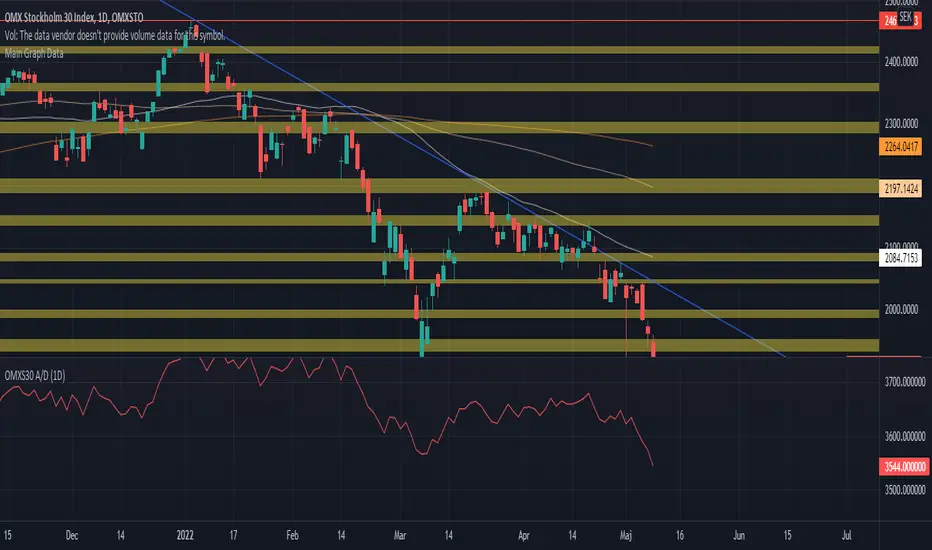
OMXS30 A/DThe script implements the Advance / Decline indicator (A/D) for the Swedish index OMXs30.
The logic for the script is implemented accordingly:
A/D = Ʃ (A - D)
A = Number of daily advancing stocks in the OMXS30 index
D = Number of daily declining stocks in the OMXS30 index
The stocks included in this script as part of the OMXs30 index was last updated 2022-05-09
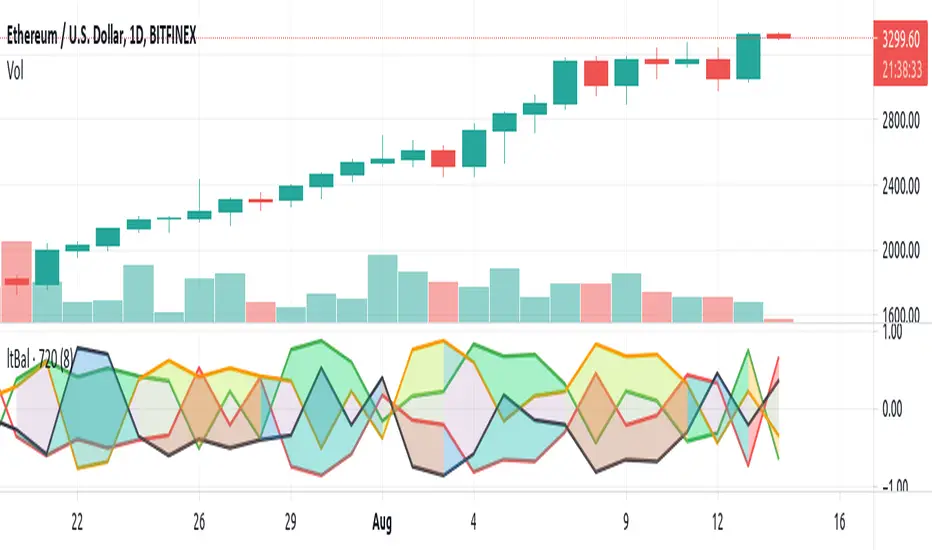
Light BalanceThe script is simple, going for a color scheme logic which tenderly avoids rigorous signals processing.
For the script to remain simple, logical derivatives are also out; as such, there are no secondary relations built off of primary ones. And it also ignores (unless you do this yourself) the logic in a varying order of lines.
Coloring has been done according to a limited set of relations between the four (4) plotted lines.
Quite a bit of information is capture, as you'll see when looking at line order, crossings, and transparency transitions and their patterns.
The approach makes the relations ones which can be learned over time; you become the algorithm to sort out signals. Ha ha. I know that sounds like a cop out doesn't it. Did I mention it's a simple script?
One thing you might want to play with right away are fills having red and green, and lime and fuchsia. It would be cool to reduce it all down to two (2) colors, but all the boolean relations might have to be listed, and it also may not be possible to cumulatively combine transparency overlays of the same value. Visually, that approach may not result to awaken a useful feature anyway. Also, fill() has its limitations in that it cannot be in a local scope; this includes function wrapped calls to fill(), or calls made using branching logic statements if/elseif, iff(), and var = (cond) ? t_val/exp : f_val/exp. So, to my knowledge, a fill() can not be made to be logically on/off.
Please, enjoy getting some use out of it.
FullPac4Trader (I.Denis)The script combines the three most important indicators on the chart.
1. A set of six moving averages ( EMA and SMA ), which can be turned on and adjusted at your discretion.
2. Indication of support and resistance levels, calculated according to the Bollinger scheme.
3. Pivot Point and the nearest goals using the Floor method with the possibility of selecting a time period.
The script version is v.1 (beta)
The development of this script will continue. Feedback and suggestions are welcome.